SmartFloor
Update (June 2020): This work has been published in PETRA ‘20
Summer 2019
I participated in a Research Experience for Undergraduates (REU) in the computer science department at the University of Texas Arlington. The theme for the summer was “Assistive Technology for People With Disabilities”.
My team was assigned to use a Smart Floor (described below) to address the issue of fall risk among elderly people. As people age, the complications associated with a fall-related injury become more serious. For seniors, the effects of a fall can be irreversable and sometimes fatal.
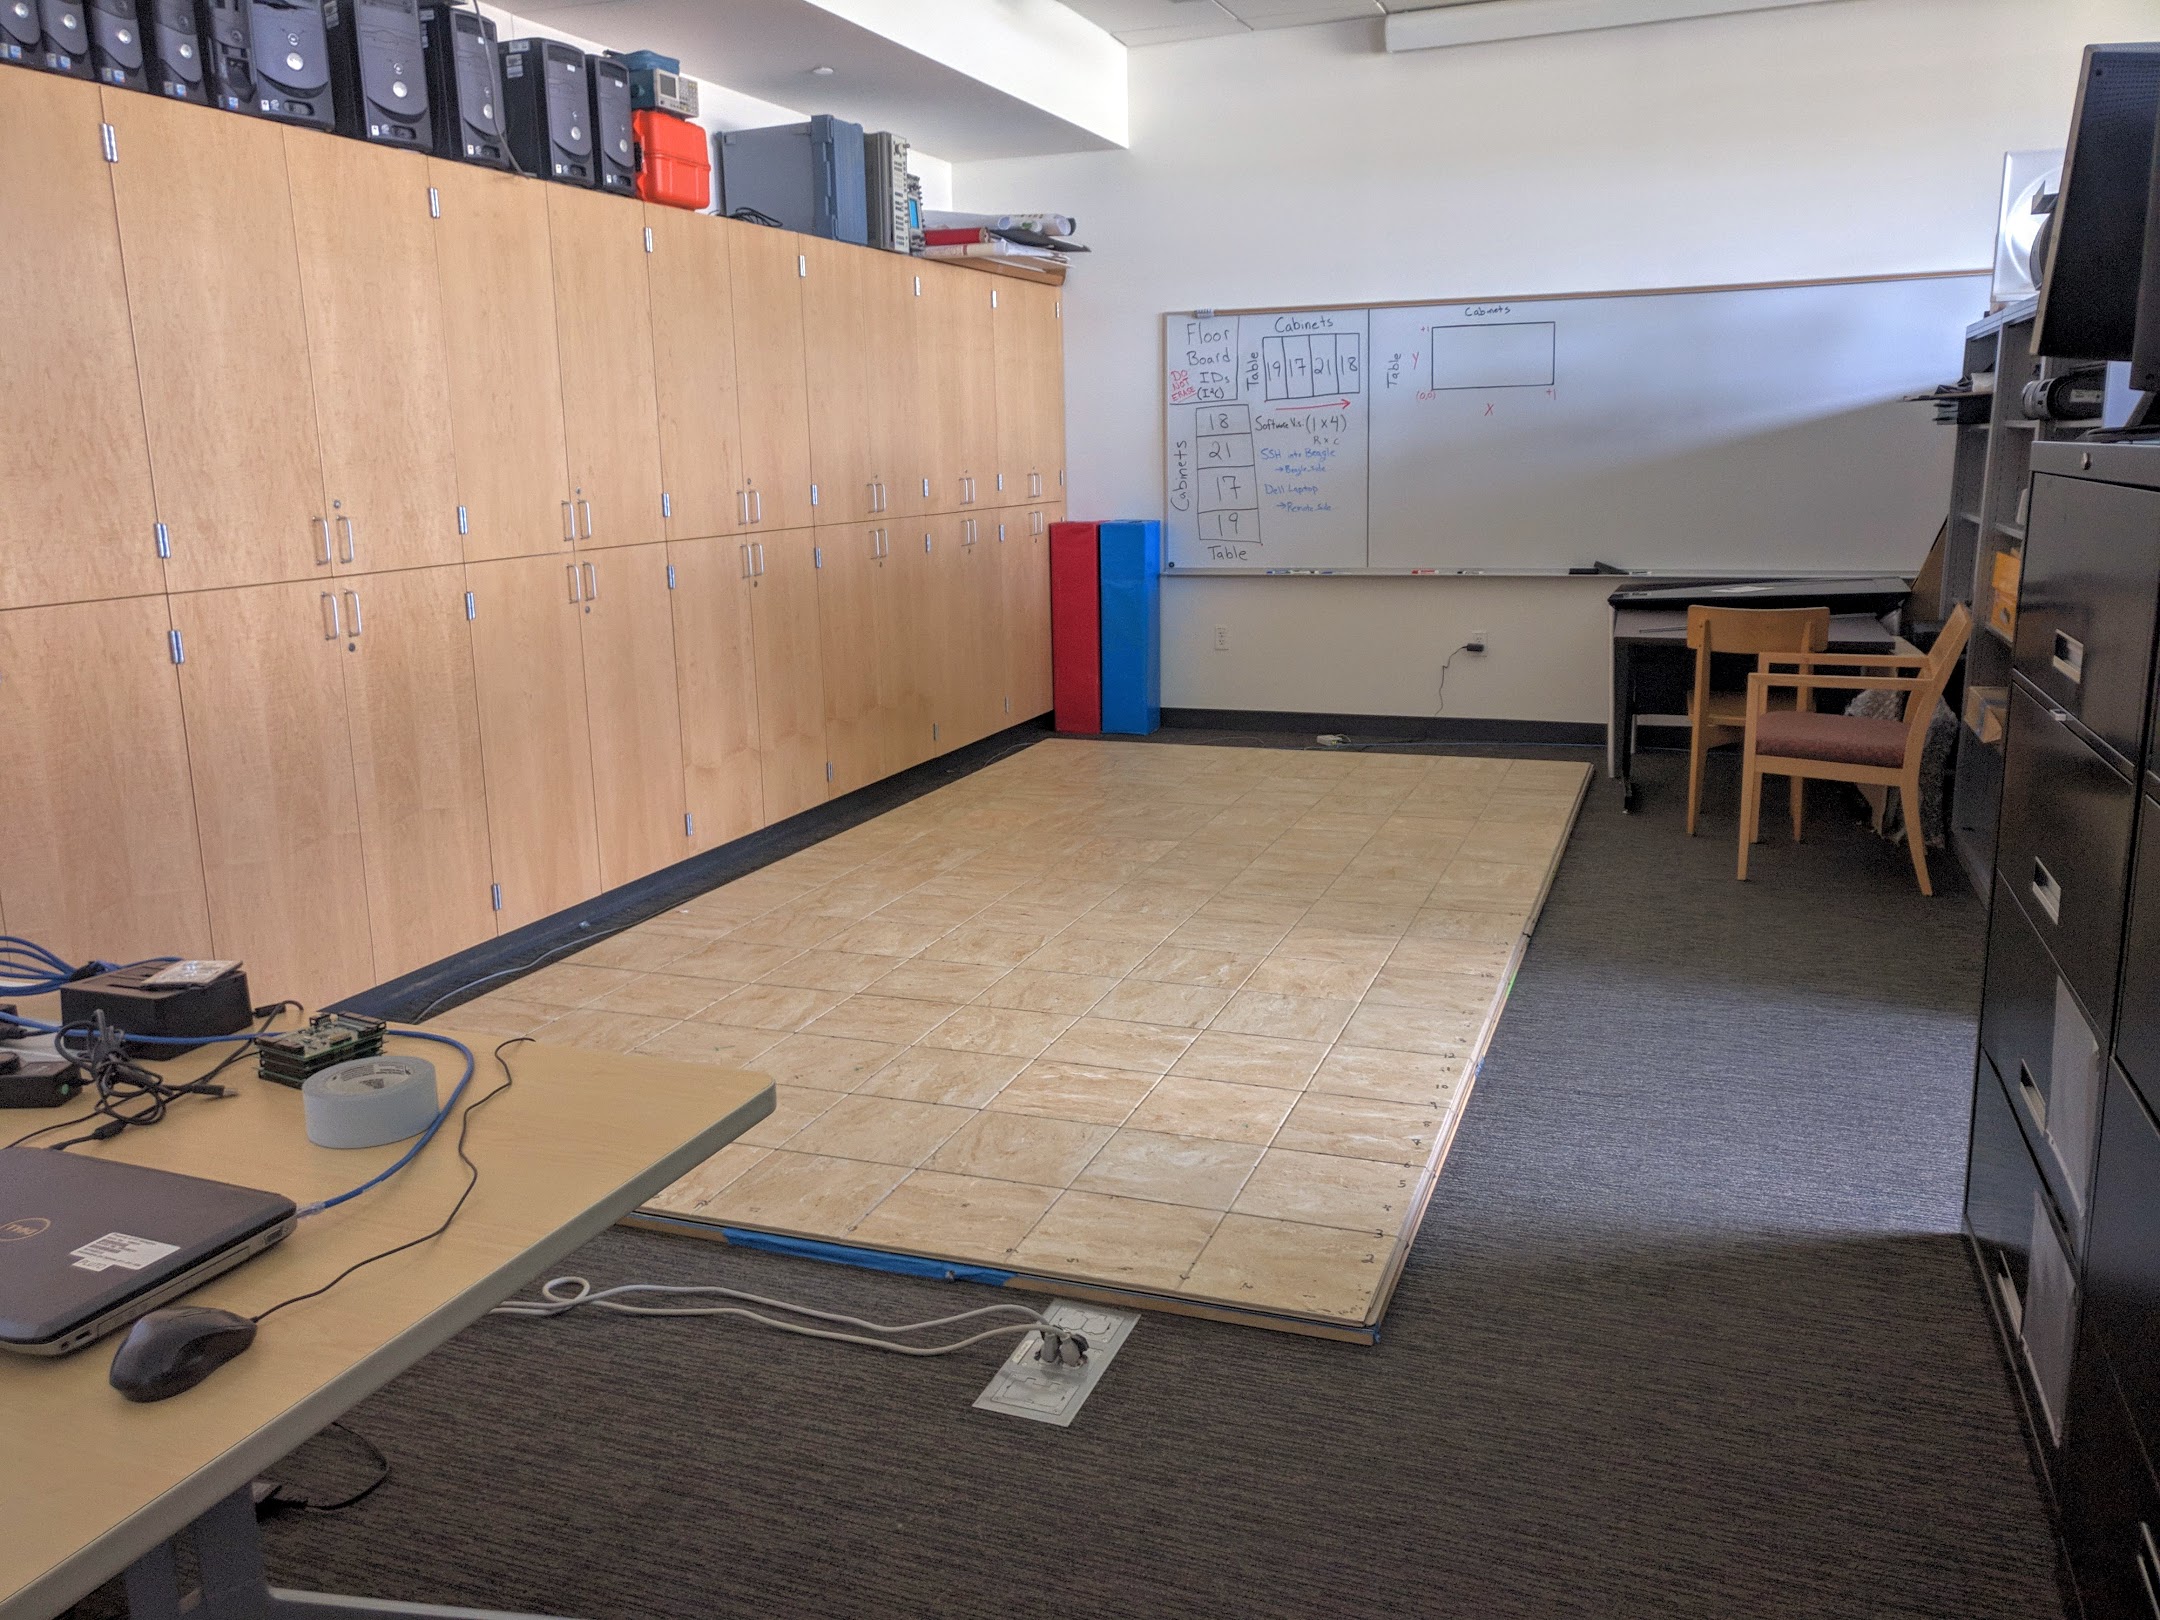
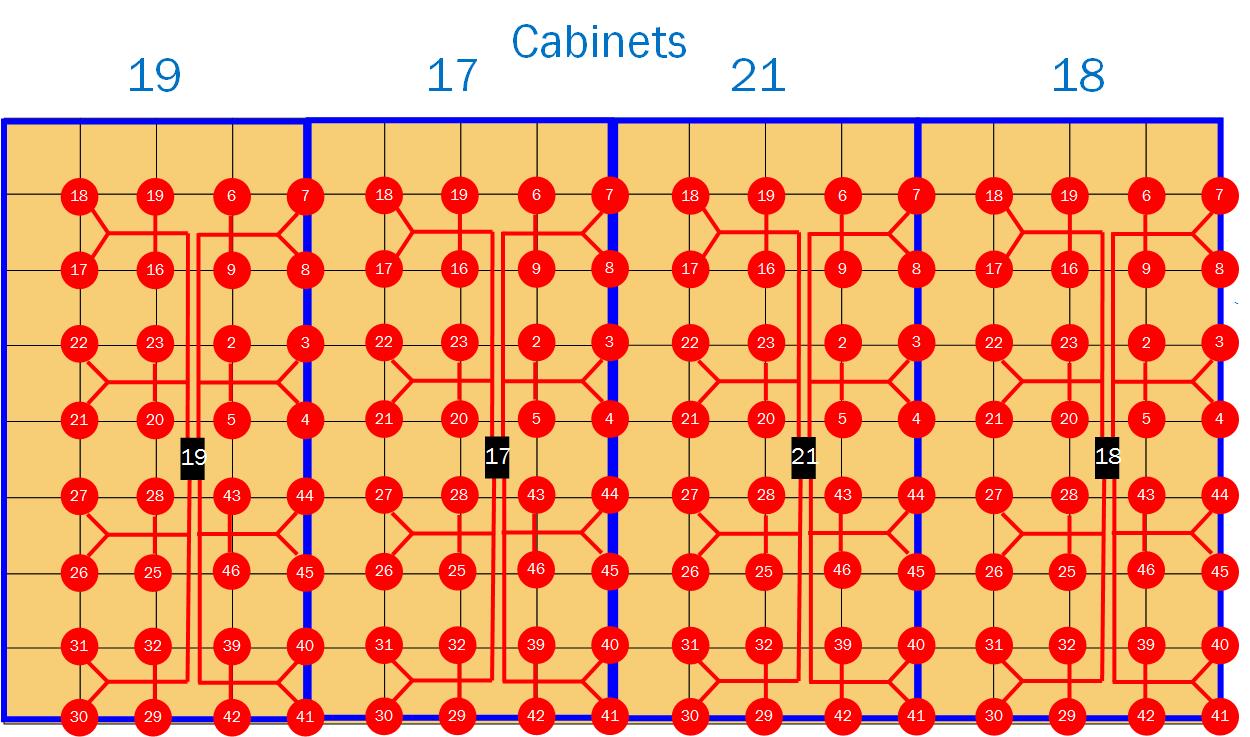
The SmartFloor is a pressure sensitive floor unit. Linear pressure sensors are placed at tile intersections, appoximately one for every square foot. The floor is divided into four panels, each of which communicate with a BeagleBone Black host. Data is retrieved from the host over the network. Readings from each panel are collected at 25 Hz.
Our proposal: Turn the ambient pressure readings into a 3D animated avatar of the user’s gait. This would allow continuous remote gait analysis from a caretaker through natural, visual assessment. While resolution of the sensor array is low, a center of pressure can be calculated to see subtle shifts in the user’s weight. In theory this could encode a great deal of information about their gait.
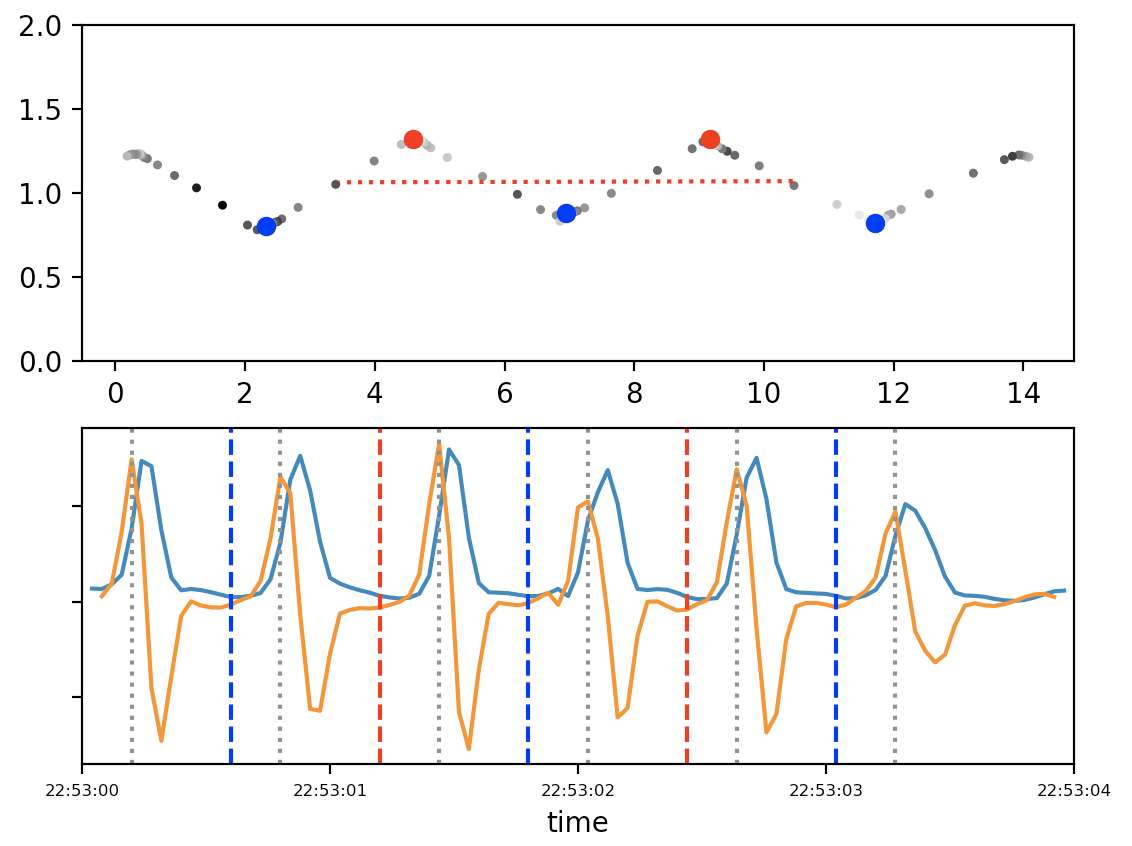
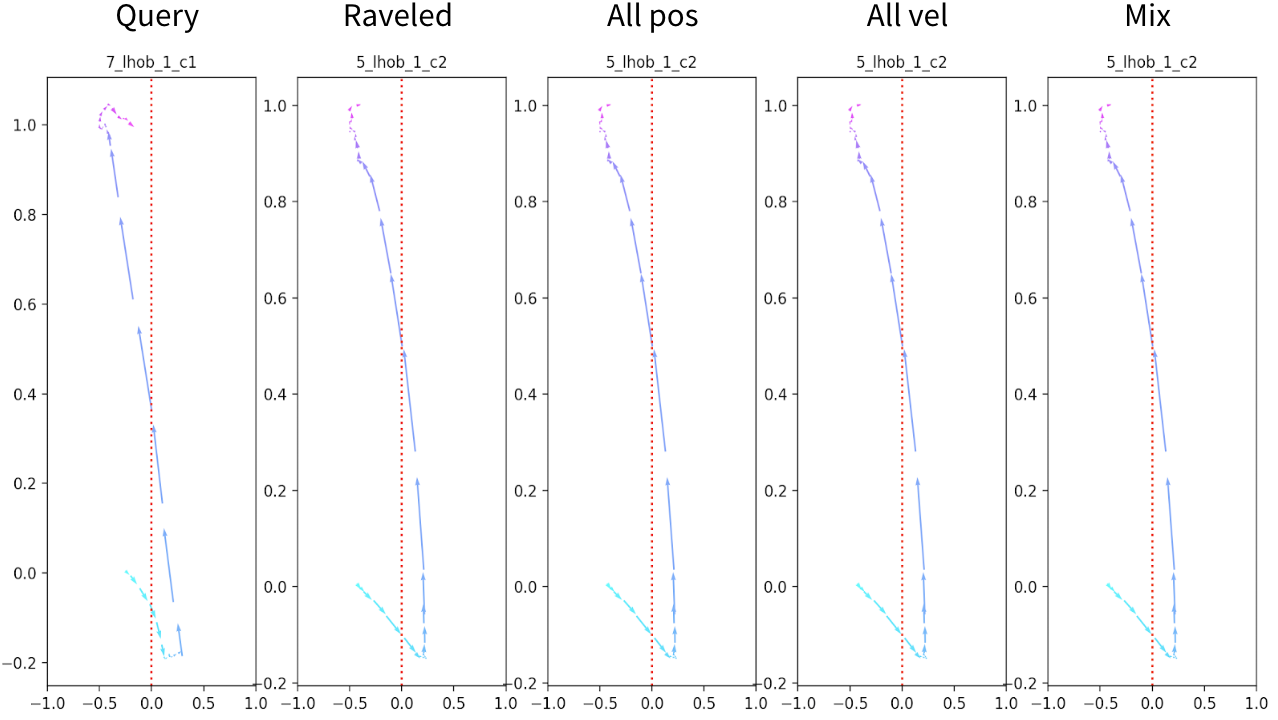
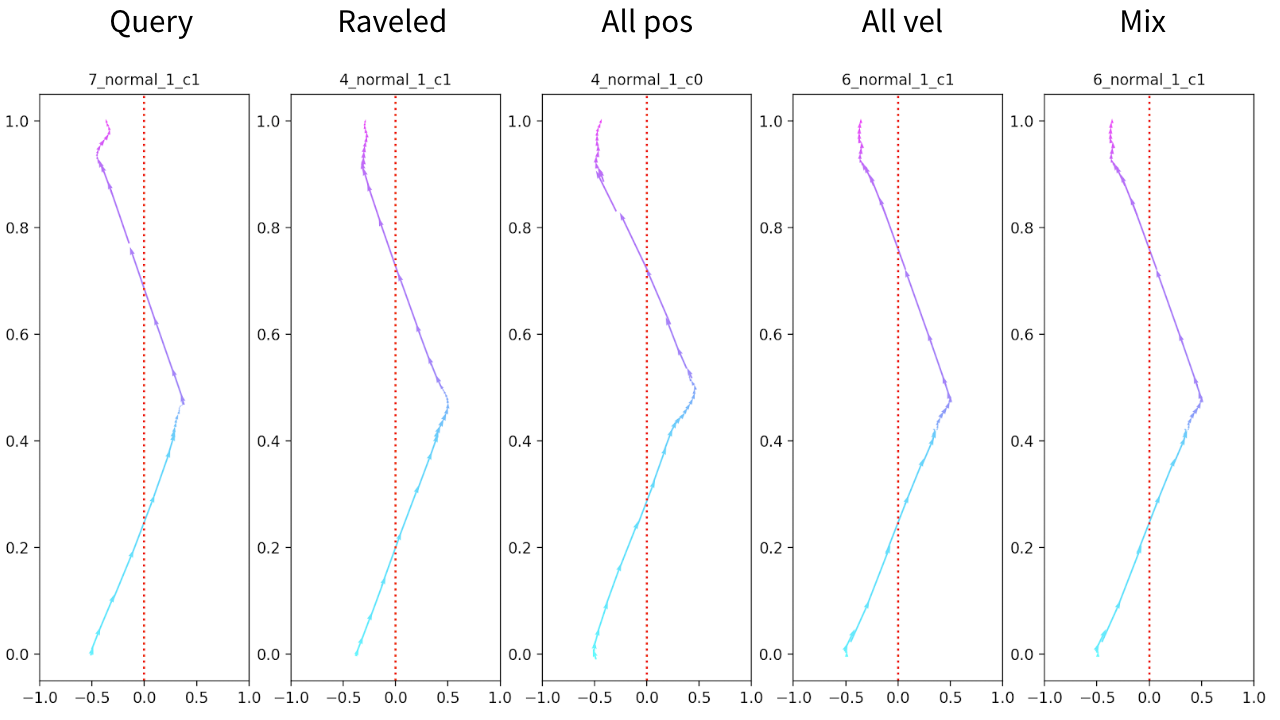
In fact, the center of pressure (COP) allowed me to build a clean trajectory of the user. I detected heel strike timing and toe position by looking for extrema in COP acceleration and velocity. The direction vectors for these foot positions allowed for left/right footstep classification.
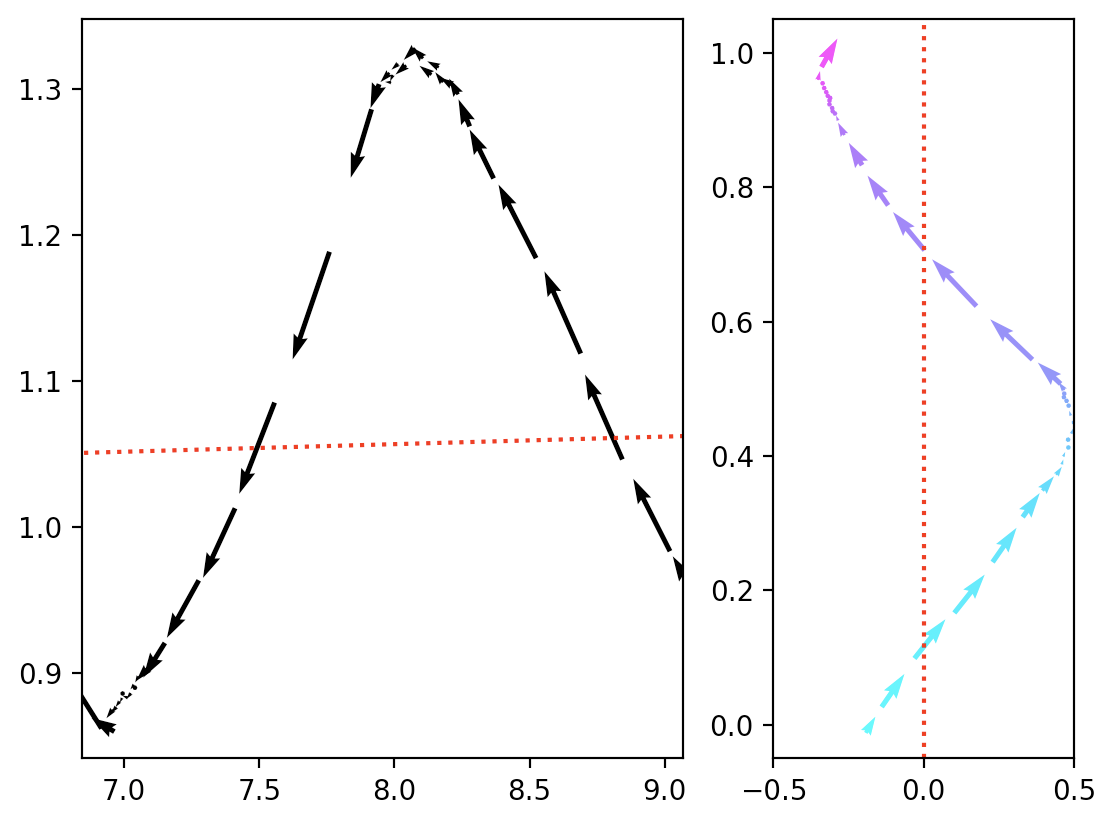
I segmented the trajectory into gait cycles marked by right heel-strikes. I normalized each cycle’s trajectory to account for the difference in heights of each user. I implemented a path similarity metric using a weighted sum of differences in position and velocity throughout the cycle. With this, I performed a nearest neighbor lookup of the most similar gait cycle in a collection of previously recorded data. The previously recorded data had been mapped to skeletal recordings using a Kinect v2. Thus, we could merge the skeletal data of the most similar match for each gait cycle into one big skeltal animation. This last step (merging the recordings) could not be finished due to time contraints. However, tests on gait abnormality classification revealed very high accuracy at correctly matching new data to the appropriate abnormality in the database (e.g. left hobble or right hobble).